Histogram range selection
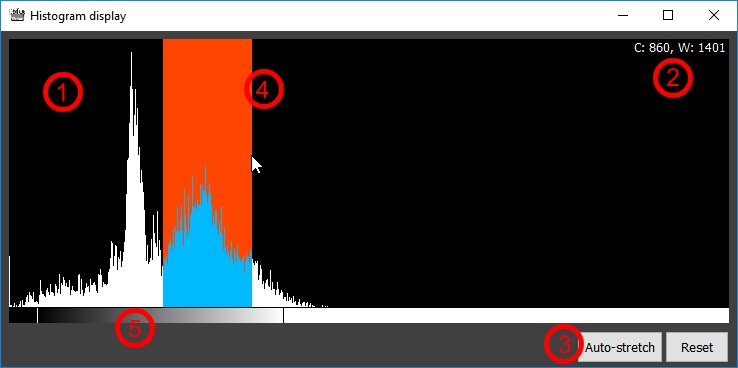
- 1. Main histogram display
The full histogram of the displayed image.
- 2. Centre (C) and Width (W)
The 'C' indicates the centre position of the selected display range.
The centre of the histogram is 860, which means that image intensity 160 [C:860 - (W:1401 / 2)] and all values below are displayed black. All initensities from 1561 [C:860 + (W:1401 / 2)] and up are displayed white.
The 'W' is the width of the histgram, the number of intensities covered by the histogram.
The width of the histogram is 1401, meaning that a total of 1401 image intensities are displayed from black (0) to white (255).
- 3. Tools
Press the 'Auto-stretch' button to apply a calculated display range.
Reset the values by clicking the 'Reset' button.
- 4. Select a histogram display range (width)
Click-and-hold with the mouse on the histogram and drag to select a display range of the histogram to be displayed. Release to display the selected display range. This affects the Centre (C) and Width (W) value
- 5. Drag histogram display range
Click anywhere on the palette panel to drag the histogram display range. This affects the Centre (C) value.
The palette panel shows which image intensities are displayed black, white or the intensities of the display range.
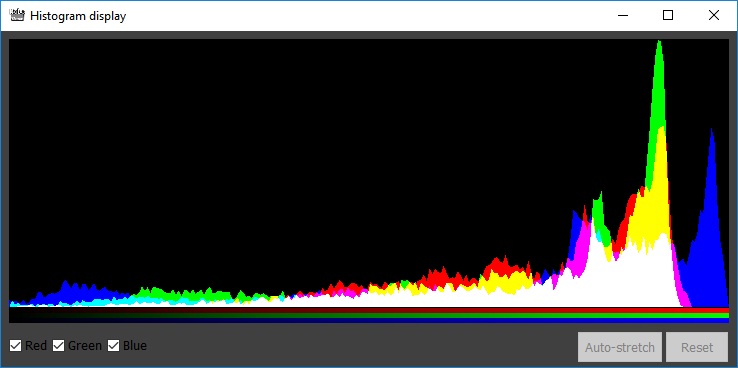
- Colored images cannot be manipulated. The color channels in the histogram can be switched of or on by clicking the checkboxes of the red, green and blue channels.

Colored image histogram

